Goals of the project
Historically, traffic monitoring has been limited to a small portion of highway networks because the necessary dedicated infrastructure is costly to install and maintain. This project created a transformational change in traffic management by using probe vehicle speed data made available through cellular communications. This expands monitoring capabilities to the entire highway network without having to install and maintain dedicated sensing equipment and communications infrastructure. In addition, by maintaining more detailed time and spatial resolutions than dedicated infrastructure data, the project also enhances the capabilities of monitoring systems and traffic management centers.
Nature of the Collaboration
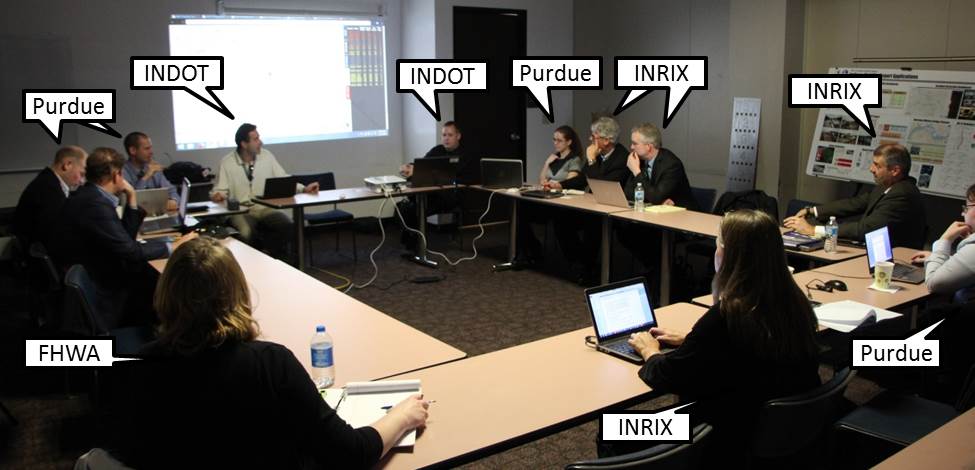
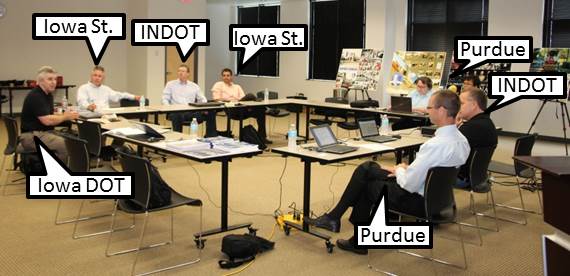
This project has been characterized by a very tight implementation schedule that necessitated close collaboration between all of the partners involved. Purdue’s research staff have worked very closely with the data provider to rapidly deploy the analysis dashboards. At the same time, constant communication was maintained with the implementing public agency to validate and train Indiana DOT Traffic Management Center dispatchers and law enforcement. Each of these stakeholders has been active during development, validation, and deployment. The research team and public agency staff have communicated the findings to peer agencies during the life of the project, rather than waiting months or years following its conclusion.
Skills
Specific technical skills required for this project have included a combination of traffic engineering, statistical analysis, computer programming, database management, web development, design, and usage of geographic information systems (GIS). Each of these played a critical role in developing the final project (a series of web-based dashboards) because the research products are based on a very large data set consisting of spatially oriented traffic information. In addition to the basic needs of translating spatial data into structured performance information, graphical visualizations had to be designed to make these understandable and to publish them in a web-based format. In addition to the web based tools, reporting through traditional publishing was facilitated through close collaboration with Purdue University Press and Libraries staff to make hard copy reports available as both e-books and by print on demand services.
Tools
The research product can be described as a series of processes: Data retrieval, management, analysis, and dissemination. Each of these was accomplished using a variety of tools. Data retrieval was accomplished using automated scripts running on a Linux based server using PHP. Data management was accomplished in parallel systems running both PostgreSQL and Microsoft SQL Server. The analysis and dissemination processes have evolved throughout the project. The initial prototyping of production graphics were carried out using spreadsheet software (e.g., Excel). These were later reproduced in a more dynamic web based format using HTML, Javascript, PHP, and open-source charting plugins.
Process
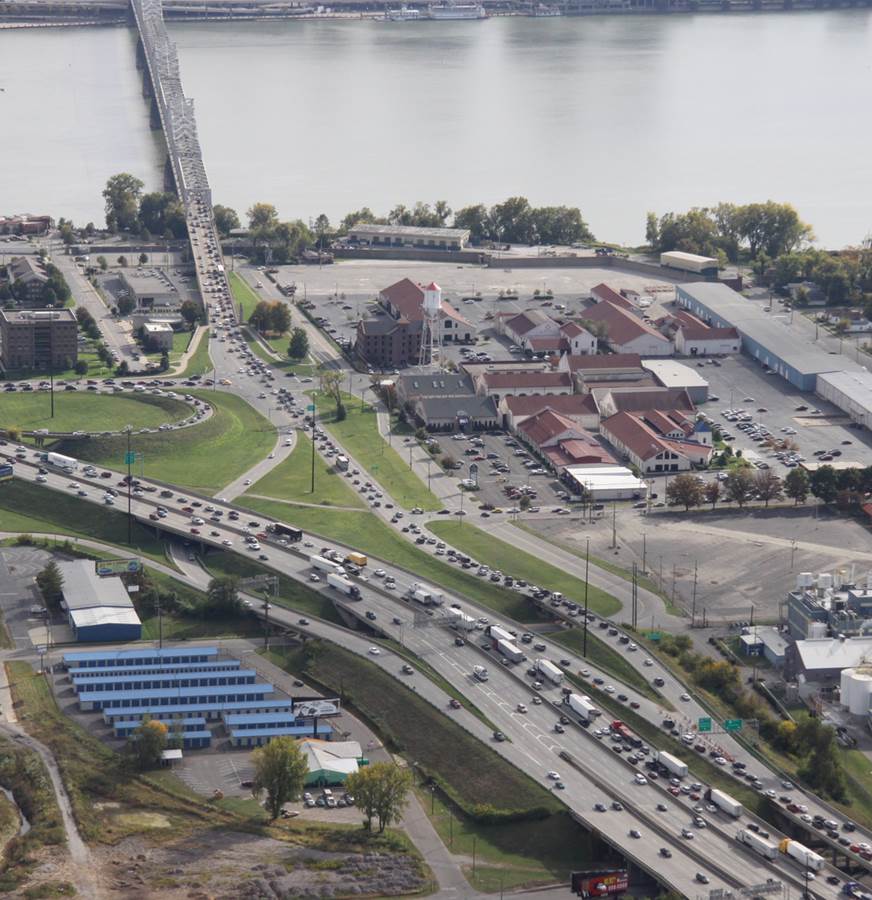
The research originated from the 2011 closure of the I-64 Sherman Minton Bridge crossing the Ohio River near Louisville, KY. This diverted a large amount of traffic to the I-65 bridge (Figure 5), and the Indiana Department of Transportation (INDOT) needed a quick way to measure the impacts to fine tune their congestion management activities. Due to the need for immediate data, there was no time to construct traditional dedicated sensing infrastructure. The use of crowdsourced probe vehicle data was proposed as a means of providing the necessary operational data. This new data source was quickly implemented and validated through partnership with INDOT, the data vendor (INRIX, Inc.), and the research team at Purdue University. Initial results included visualization graphics of the network adjacent to the bridge closure, but it was quickly realized that similar analysis could be extended across the state to assess the overall performance of the highway network in Indiana. This led to the production of the award-winning Indiana Mobility Reports series, which has gone on to become a valuable tool for engineers, planners, and other stakeholders in Indiana. These initial successes led to the subsequent development of online dashboards to present up-to-date data and a real-time incident detection system.
Milestones
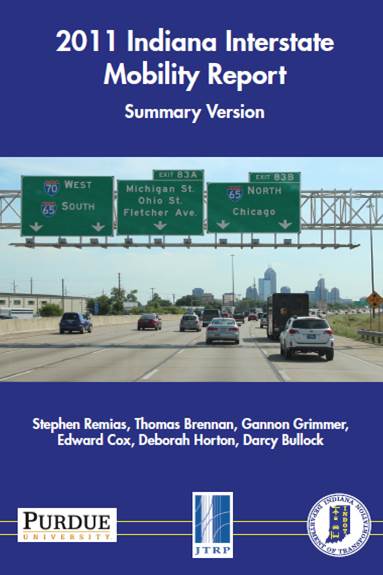
The initial prototypes consisted of analyses of congestion on I-65 as a result of the I-64 Sherman Minton bridge closure. These prototypes consisted of poster-sized graphics showing the regional performance of I-65 with considerable detail. Further analysis led to the design of a portfolio of visualizations that were then applied to the entire state Interstate network in the first Indiana Mobility Report for 2011.
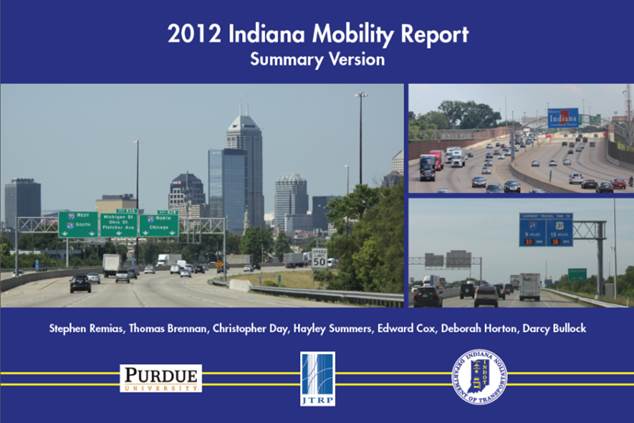
The initial results were highly successful and the power of the visualization graphics led to requests for application in other situations. This included a series of case studies focusing on impacts related to Interstate work zones and traffic signal re-timing that were summarized in the 2012 Indiana Mobility Report.
The next phase of the project moved from the “static” analysis of archived data to the real-time analysis of current data. This led to the development of web-based dashboards capable of reviewing visualizations describing the recent system state, as well as a system for detecting incidents on the freeway system.
Challenges encountered
This project required the handling of a large amount of data (billions of minute-by-minute average traffic speeds for hundreds of directional highway segments distributed across the state). A number of challenges were presented in the retrieval and storage of this data that were solved through a combination of experimentation and application of basic database management principles by the research team. The next order of business was translating the data into useful information, which required the segmentation of the spatial data so that it could be compiled and presented in meaningful ways. For example, all of the segments within a route had to be spatially organized to understand the performance as it changed along the route. This was accomplished through analysis of the GIS shape files describing the routes. The key insights learned from these initial data management activities later informed the organization of the data when it was applied to additional roadway systems as they were included in the analysis, and later in a pilot national level analysis along I-80 from coast to coast (Figure 6).
In addition to the technical challenges, there were also institutional concerns that had to be managed; the research team in some ways was an intermediary between the private sector data provider and the public sector transportation agency. Assessing their needs individually and collectively was important to ensuring that each party came away from the project with some successes that they could present to shareholders or elected officials. Management of these interactions early in the project has been vital to providing sustainability for all parties as the research products are increasingly integrated into both the underlying data and in agency processes.
Major outcomes
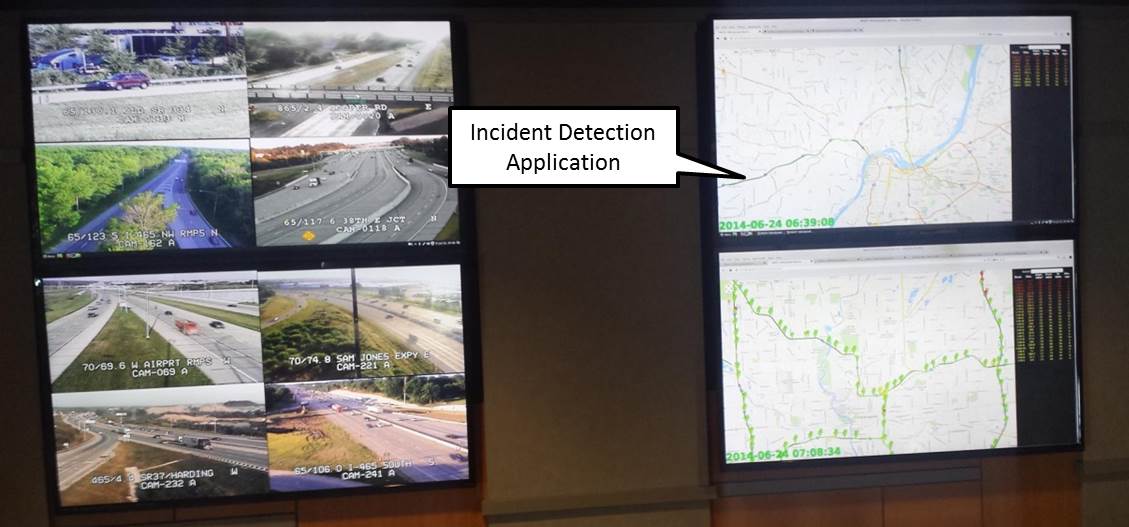
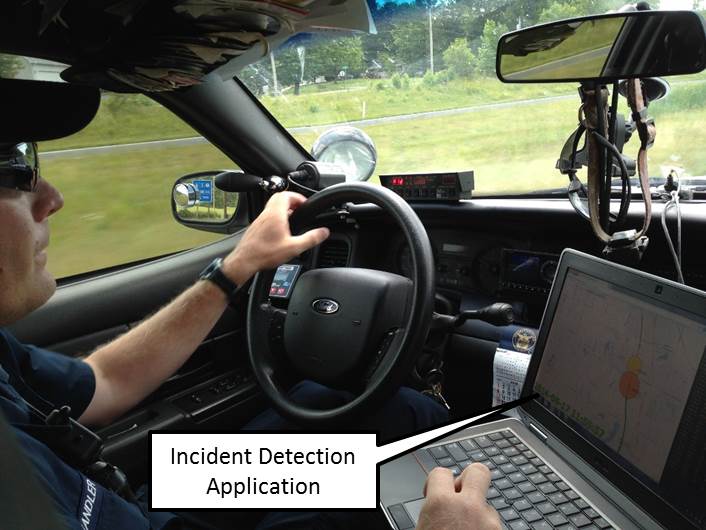
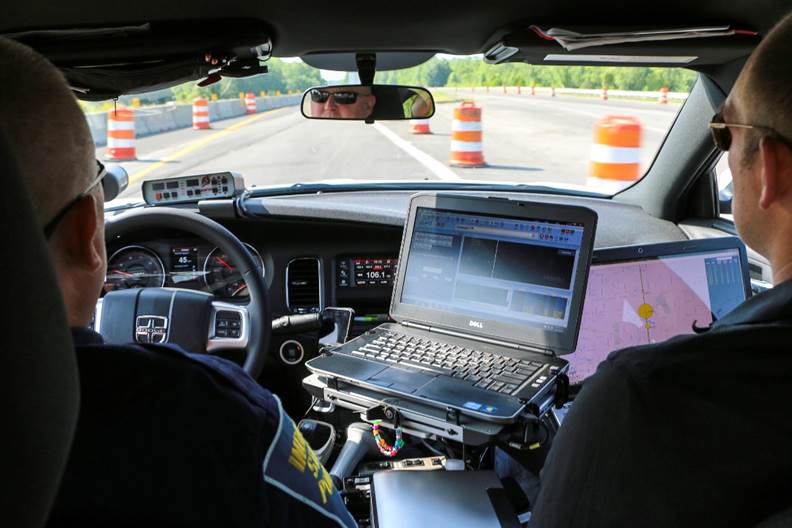
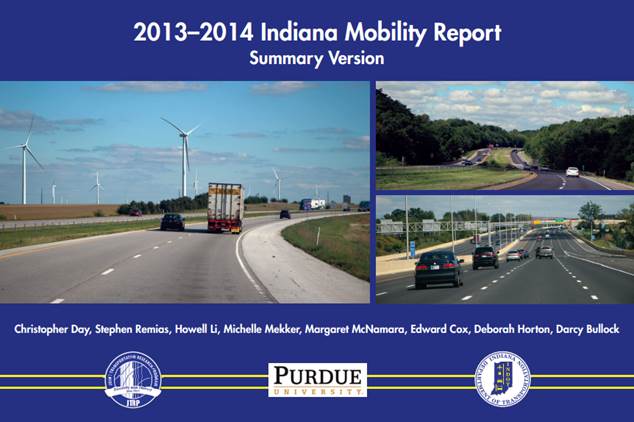
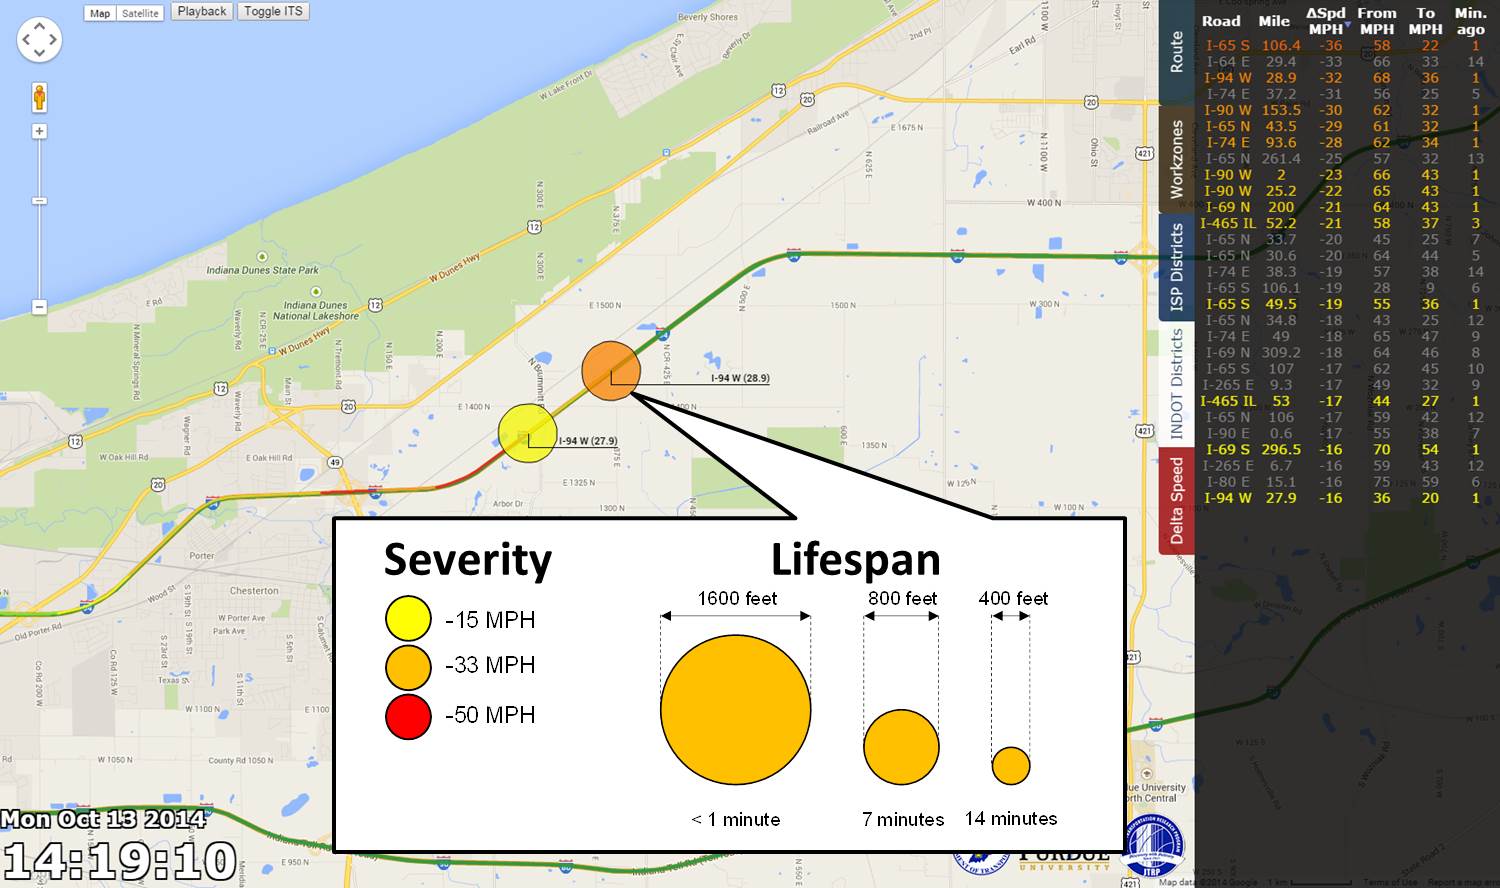
The Indiana Mobility Report series has been published annually for the past three years, documenting the condition of the state’s highway network in the previous year (Figure 7a, Figure 7b, and Figure 7c). This report series has been recognized in the Indiana General Assembly and the INDOT Chief of Staff presented the material in the U.S. House of Representatives Committee on Science, Space, and Technology, Subcommittee on Research and Technology. It has become a resource for INDOT planning and engineering staff. The desire for seeing similar data in a more up-to-date fashion led to the development of a series of web-based dashboards that can present the system state in real-time. An incident detection system was developed on this framework, which can identify the location of queues on the freeway system (Figure 8). For additional Impacts of the Indiana Mobility Reports see the attached “Mobility Reports Activity Impact Timeline”.
Innovations, impact and successes
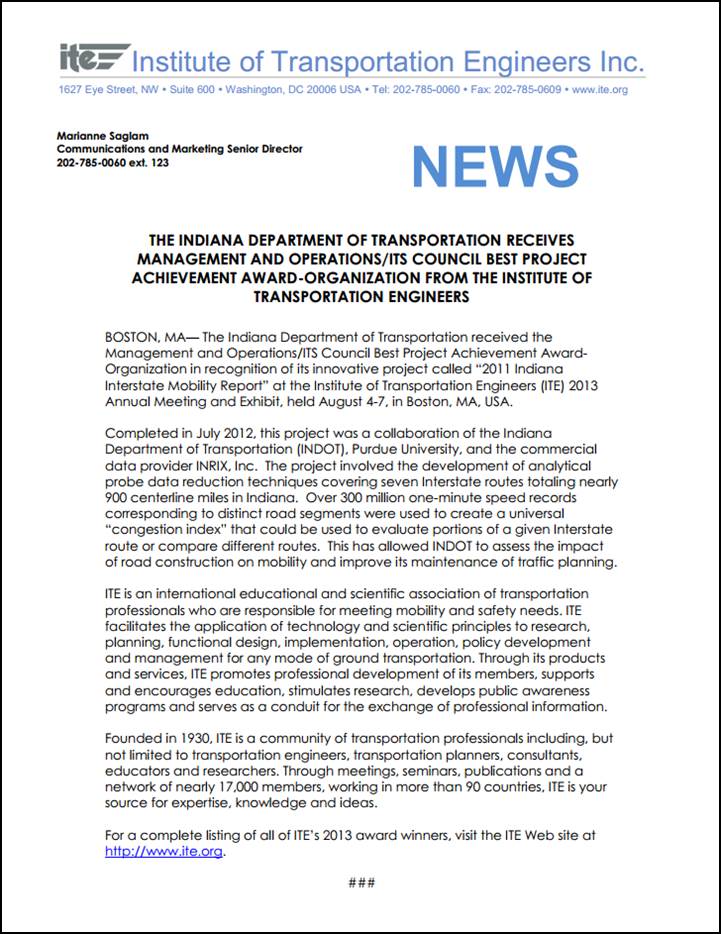
The research led to a number of innovations in the visualization of congestion on roadways, based on “complete” knowledge of traffic conditions along longer stretches of roadway than can be obtained through instrumentation with static sensors. The Indiana Mobility Report series are being widely adopted by peer states, and the 2011 Mobility Report was recognized by ITE with the Management & Operations/Intelligent Transportation Systems Council 2013 Project Achievement Award (Figure 9). They have been used extensively by planners and engineers to inform the selection of capital projects and understanding the impact of work zones. The web-based dashboards are currently being used by Traffic Management Center operators and the Indiana State Police to mitigate the impacts of work zones and other occurrences of congestion, which can be used to identify and alleviate queued workzone traffic before secondary crashes occur. Currently, the data is being applied to develop a variable speed limit methodology to help reduce motorist speeds when queued conditions are detected. Each of these contributions aims to help roadway networks become safer and more efficient.
 Darcy Bullock